library(tidyverse)
library(haven)
library(labelled)
library(sjlabelled)
library(sjPlot)11: Qualtrics II
Overview
This tutorial will focus on efficient, transparent, and user-friendly techniques for working with data specifically gathered using the Qualtrics survey platform. We will cover how to import and work with labelled data from Qualtrics and how to reduce data management headaches down the line by setting up a well-structured and thoroughly labelled Qualtrics survey from the outset.
Acknowledgements
This tutorial was co-conceived and co-created with two brilliant PhD researchers, Hanna Eldarwish and Josh Francis, who contributed invaluable input throughout the process of developing the tutorial. This included collecting commonly asked questions and issues with Qualtrics data analysis; discussing the topics to cover and how best to cover them; and testing code and solutions. Hanna Eldarwish also provided the basis for the dataset, collected during her undergraduate dissertation at Sussex under the supervision of Dr Vlad Costin.
Setup
Packages
As usual, we will be using {tidyverse}. When {tidyverse} is installed, it also installs the {haven} package, which we will use for data importing. However, {haven} isn’t loaded as part of the core {tidyverse} group of packages, so let’s load it separately. Finally, we will also need the {labelled} package to work with labelled data.
Data
Today’s dataset focuses on various aspects of meaning in life (MiL), and has been randomly generated based on a real dataset kindly contributed by Hanna Eldarwish and Vlad Costin. All variables have been randomly generated, but they are based on the patterns in the original dataset. The original, bigger dataset will be made available alongside article publication in the future, so keep an eye out for it!
New File Type
You might notice that instead of the familiar readr::read_csv(), today we have haven::read_sav(). That’s because the file I’ve prepared is a SAV file, associated with the SPSS statistical analysis programme. The next section explains why we are using this data type, but otherwise, there’s nothing new about these commands.
Codebook
This codebook is intentionally sparse, because we’ll be generating our own from the dataset in just a moment. This table covers only the questionnaire measures to help you understand the variables.
| Variable Prefix | Scale | Subscale |
|---|---|---|
| global_meaning | Meaning in Life | Global Meaning |
| mattering | Meaning in Life | Mattering |
| coherence | Meaning in Life | Coherence |
| purpose | Meaning in Life | Purpose |
| sym_immortality | Symbolic Immortality | Single scale |
| belonging | Belonging | Single scale |
Building a Qualtrics Project
The following sections contain not one, not two, but three different ways to do the same thing. Why? Well, at this point you probably have a good sense of how much you like or want to use R, and how confident you feel using tricks and shortcuts, like <tidyselect>, across(), etc. I’m sure you also have a sense of how I feel about this: I will pretty much always choose the method that is the most elaborate and efficient in the long run, even (especially??) if it means more work in R to get it set up. However, I fully appreciate that not everyone is like me, and would prefer the more transparent, less intensive options in order to get the job done.
So, I’ve described three ways to set up a Qualtrics project. First, by “set up a Qualtrics project”, I mean creating everything you would need for the data gathering, managing, and organising side of running a study using Qualtrics. That includes setting up Qualtrics itself and cleaning and reviewing the dataset ahead of analysis. This doesn’t include the data processing and analysing portion of the study - that’s been covered extensively in previous tutorials.
I also hope that this description will give you a sense of what these different R-intensity levels look like, and how much of an investment each is. Do keep a few important things in mind as you’re exploring the options below:
- These levels build on each other. Starting with “Minimal” might be where you’re at now, but it’s also a good idea, especially if these tutorials are your only experience with R so far! You can always come back and explore more complex options if you find you’ve mastered the first level and want to streamline your study process.
- I really, really don’t have a good sense of it, but I suspect that in a typical University school/department, not many people - maybe none - are doing the Majority option (described below). I looked into it for the purposes of writing this tutorial, so I don’t even use it myself (yet)! You might even find it doesn’t work as well as I’ve described, so let me know if you have any suggestions.
Choose Your Path
The next sections will be organised as Minimal, Moderate, and Majority based on the approaches described below. Following the steps in each section will each walk you through the process of building and maintaining the data from a Qualtrics study, but you will come out with a different underlying infrastructure depending on which level you go for.
| R Level | Duplication vs Efficiency | Advantages | Disadvantages |
|---|---|---|---|
| Minimal | I want to get it done now and I'm not worried about having to do the same thing again in the future | Get everything set up straightaway | May have to repeat fiddly steps, change small details, or redo large chunks of the same process for the next time round |
| Moderate | I want to make it easier for myself in the future without getting bogged down in too much R | Less work to reproduce down the line | Requires more upfront time investment and some advanced R usage |
| Majority | I'm willing to spend more time setting things up now, so I can duplicate or redo as little as possible in the future | Set up an efficient, replicable system that can be adapted for future projects | More time-intensive to create, requires more knowledge of R and/or willingness to experiment with new packages/structures |
Made your choice? Brill. The following sections of the tutorial will guide you through how to set up, download, and work with Qualtrics data for each level. Note that you can mix and match as you like, of course, but this tutorial isn’t designed that way.
Accessing Qualtrics
The following directions walk you through logging into Qualtrics, assuming you have a Sussex login. If not (hi!!), you’ll need to get in touch with your own IT department if you’re not sure how to access Qualtrics.
You can start on the University of Sussex homepage, then use the Search function to search for “ITS Qualtrics”. Similarly, you can also start on Google1, and search for “ITS Sussex Qualtrics”. Either way, the first result should be the one you want: ITS Sussex’s Qualtrics Guide. There’s a friendly video and some info here, but the most useful stuff is at the bottom of the page, where there are instructions for logging in using your institutional ID.
Clicking on the big friendly “Log into Qualtrics” button under the video will get you to the home page of Qualtrics. Welcome!
Creating a Project
From the main landing page after login, click on the big blue button in the upper right-hand corner of the screen reading “Create project”.
You’re welcome to look through the templates that Qualtrics includes, but I always ignore them and click under “Survey” under the “From scratch” heading, then the blue “Get started” button on the sidebar. (There’s a link to the very helpful Survey Basics Overview page that it might be worth referring to if you’ve never worked on Qualtrics before.) Finally, you’ll see the “Create a new project” screen, asking you to name your project and put it in a folder. The name you give your survey under “Name” will be the name that your participants see as the title of your survey, so pick something that sounds professional! You can put your new survey in the default folder if you like, or in a folder if you’ve made one. Finally, click “Create project”.
Minimal
At the minimal-R level, we’re not going to worry about futureproofing any of these steps, essentially assuming this project is a one-off that just needs to be done ASAP. So, we’ll do everything “by hand” - that is, without any extra code or shortcuts.
Set Up Qualtrics
Follow the steps in the previous section to log in and create a survey first, then pick up from here once you have a new, blank survey to work with.
Using Blocks
Blocks are the way that Qualtrics organises pieces of the survey. Essentially, everything in the same block becomes a unit. You can have multiple questions per block, or just one. Blocks are vital for creating a study that appears as you want, but they won’t have any substantial impact on the format of the data.
Explaining blocks and how they can be arranged is a bit outside the scope of this tutorial, so see the Block Options page in the Qualtrics guide for more details.
Using Questions
The core of Qualtrics are questions, which you can create within blocks. By default, a new question is a multiple-choice question (MCQ), but you can customise this in depth in the “Edit question” sidebar to the left of the survey. To edit a question, you have to click on each question, which will outline the question in a blue box; you can then change the settings for that question in the sidebar.
Tip
For extensive help on creating and work with questions, see the Qualtrics Guide.
Questions in R
Let’s have a look at the default question, which appears like this:
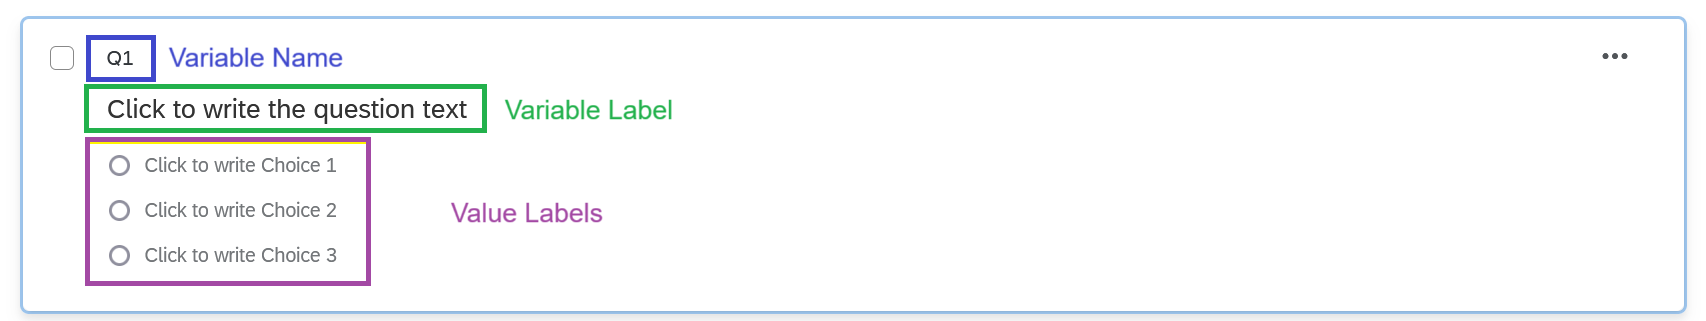
As you can see here, the way that you set up your questions translates directly into the way your dataset will appear.
- Names: All questions are automatically given a name, by default Q[number], e.g. Q1, Q2, etc. This question name will appear as the variable name in your exported dataset. These names are not visible to your participants.
- Text: Question text is the actual question that your participants see. This question text will appear as the variable label in your exported dataset.
- Choices: For questions with a specific set of choices, like multiple-choice questions and rating scales, the choices you list here are the response options that your participants see. These choices will appear as the value labels in your exported dataset.
You may notice that there’s no evidence of the underlying numerical values for each choice. Although Qualtrics doesn’t make this immediately obvious, they are always worth checking, because sometimes they’re…creative. This doesn’t matter so much for questions that are going to become factors - whether the underlying number is 1 or 14 or 73 doesn’t matter because they’re just a marker for a unique category. However, we’ll see in a moment an example where it does matter, namely rating scales.
To check the values, click on the question, scroll down to the bottom of the Edit Question sidebar, and click on “x -> Recode values”. This opens a new pop-up window where you can edit a few options:
- Tick Recode Values to change the numeric values for each choice. These values are the underlying values that will appear as numbers in the dataset in R.
- Tick Variable Naming to give different value labels to the choices than the ones the participants see. (Personally I’d be very wary of doing this, as it would be easy to lose track of what participants actually saw/responded to!)
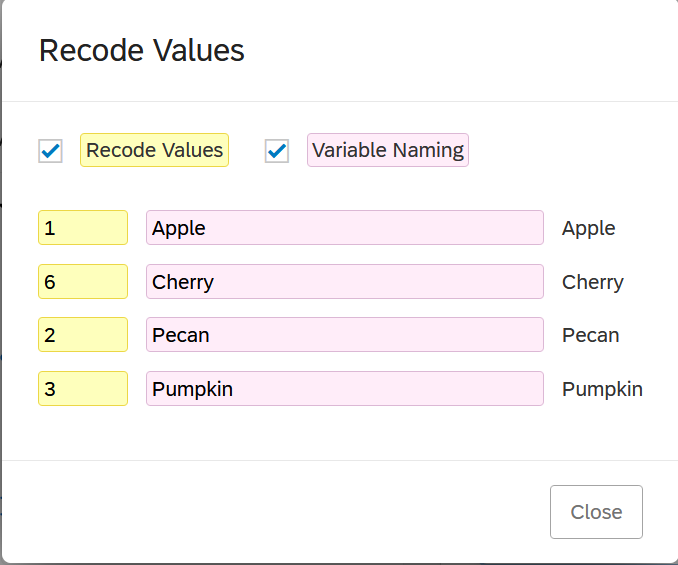
As you can see from this simple “What’s your favourite pie?” question, these underlying numeric values can go wonky quickly. I have four options, “apple”, “cherry”, “pecan”, and “pumpkin”, which are numbered 1, 6, 2, and 3 respectively! What’s happened is that I created “apple”, “pecan”, and “pumpkin”, and then a couple other options; then I changed my mind, removed the other options (which would have been 4 and 5) and added “cherry” after “apple”. Values are assigned based on the order they are added, which is why the values came out weird and out of numerical order. If I wanted these to go in order (which isn’t a bad idea, since you want your data to be predictable), I can tick “Recode Values” and then manually enter the numeric values I want for each choice.
Matrix Questions
Matrix questions are very commonly used as an efficient way to present multiple questions or items with the same response scale - for example, items on a scale or subscale with a consistent Likert response scale.
To create one, create a “Matrix table” type question. The typical setup is for the items/questions to be presented down the left-hand side as “statements”, and the rating scale to be presented along the top as “scale points”.
The “Scale points” section of the Edit Question sidebar lets you control how these scale points appear. You can add or remove the number of points, and for many scales in Psychology, you can use suggested rating scales by switching the toggle on, which automatically insert labels for each scale point for you.
Tip
Remember in the last tutorial, we could use labelled::unlabelled() to automatically convert variables to either factor or numeric. However, variables would be converted to numeric when they didn’t have labels for each value. If you use “suggested scale points” to automatically label the values, you’ll get a label for every value, so this automatic conversion won’t work unless you manually remove some of the labels.
For some reason, matrix tables are especially prone to issues with the underlying numeric values, especially if you use these automatic scale points. You’ll end up with really weird ranges, like 61-65, instead of 1-5, which will do a number on the interpretation of any descriptives. Even better, the numeric values change themselves every time you make changes to them! So, I’d strongly recommend you update the numeric values using “Recode values” as the last step to make sure you don’t have any surprises when you get round to looking at the data.
Testing the Study
Before you publish your study and start collecting responses, I strongly recommend you check that everything has been set up correctly. To do this, use the Preview button to run through your study a few times as if you were a participant. This has two important benefits. First, you can check that you have set up your questions correctly, that they appear in the order you want or conditionally as required, and any settings, like Force Response, have been implemented correctly. Second, preview runs are still recorded as data in your dataset, under the “DistributionChannel” variable (as we’ve seen before). These preview runs essentially generate a small, toy dataset to work with that will be formatted identically to your real dataset.
Do Your Worst
While you’re previewing, I recommend that you try to “break” your survey. Try to type words into the space to write in age in years (did you set data validation correctly?). Try to proceed through the survey without consenting (did you force response on the consent questions?). Skip some questions, add extra text answers, and otherwise try to test out any kind of response that might be possible with your survey. This process will help you set up your survey to restrict the number of wild and exciting choices your participants can make, so your data cleaning is less complex.
Preparing for Processing
Once you’ve done your preview runs, export your dataset and read it into R just as you would a real dataset. Here you can check that your variable labels and values are correct, that all response options appear correctly, and so forth. When you’re happy that all your data is recording as it should, you can publish your study and start collecting responses. (Good luck!)
We’re not done yet, though. As I said above, this preview dataset full of junk data is formatted exactly the same way as your real dataset will be. This means that while your study is collecting responses, you can already start writing the code to clean the dataset, generate the codebook, calculate subscales, etc. - because you already know what your variables will be named and what they will contain. Once you complete your data collection, you will already have the majority of your data cleaning work done - although make sure you carefully check your code step by step with the real data; there are always surprises!
Moderate
The moderate level assumes that you’d like to futureproof your work somewhat, to reduce duplicating the same manual setup every time.
Using Templates
Templates allow you to easily replicate the same setup across multiple studies. You can turn your own surveys into templates to use in the future, or find existing templates to adapt for your purposes.
Creating your surveys in Qualtrics with an eye to turning them into templates, or using surveys from template, has an enormous potential advantage: predictability. The demographic gender question, for example, might always be called demo_gender, so you don’t have to check or remember if it was gender or Gender_Demo or Q12 or whatever between studies - it’s always the same. Why is this the best thing ever? Because generalising code depends on predictability. If your data is predictable - if it always has the same names and the same format and contains the same type of information in the same variables from one study to another - then the code that works on one dataset will work on another2. So, not only will you save a lot of time setting up the same questions and writing the same consent forms over and over, but you can also make your data cleaning and wrangling process more automated.
Creating Your Own Template
There are a few ways to use existing surveys as templates. This is largely preference, but might depend on what information you have access to.
Copy an Existing Survey
For a survey you already have set up, you can straightforwardly duplicate it. This will copy all the settings, questions, survey flow, etc., but none of the actual responses.
Pros
- Reuse the entire survey as you originally set it up
- Easily edit it as normal for your new round of data collection
Cons
- Multiple similar copies of the same survey may get confused
- Not easy to remix elements from existing surveys
Add to Your Library
Your Library in Qualtrics is an archive of surveys, or pieces of surveys (like blocks or questions) that you might want to reuse across multiple surveys. There are public Library elements, but you can also add elements you’ve made from your own surveys to your personal Library to reuse in the future.
Pros
- Allows recombination of elements easily
- No need to remember which survey(s) contain which element(s) you want to reuse
Cons
- Somewhat unwieldy to manage (lots of clicking and naming things, setting up folder organisation)
- Difficult to share?
- Would require extra work to export library elements
Import/Export to File
For this option, you export a survey as a .qsf file. The file contains all the information about the survey, including the blocks/questions and all of the settings, survey flow, etc. You can then send this file to others, post it on Canvas, and otherwise share it however you like, and anyone who uploads it to Qualtrics will have the complete survey without any responses.
Pros
- Easy to share complete surveys with other users, like dissertation students/supervisors, collaborators
- Keep an archive of your surveys separate from institution account
Cons
- Within the same account, is essentially identical to copying a survey, just with more steps
- Can only export the entire survey, rather than parts
Using Existing Templates
Using others’ templates is largely a matter of finding something or someone who has the setup you want, and getting them to share it with you. Here are some resources to get you started:
- Psychology Qualtrics Template: A massive, open-source template containing a large number of common and widely used psychological measures.
- Sussex low-risk ethics: A template created by me for ethically low-risk online survey studies at Sussex. Includes fill-in-the-blank ethics and debrief forms, some common demographics questions, and layouts for matrix table measures. It also includes a survey flow randomising the order of the two questionnaire blocks.
To use these or other QSF file templates, the Qualtrics guide to creating a project details the process step by step.
Developing a Script
As described above, tne key advantage of using templates is that you can coordinate your Qualtrics setup across studies, and that means consistency in the details of the data, such as variable names and labels. You can then develop a script that you can use across different studies to do data cleaning and wrangling processes, without having to reinvent the wheel each time.
By a “script”, here, I don’t necessarily mean a .R script file; this could be a Quarto document as well. You could, for example, create a Quarto document that contains generalisable code for any similar surveys, beginning as follows:
file_name <- "your_file_name.sav"

library(tidyverse)

my_data <- here::here("data", file_name) |> haven::read_sav()
For future surveys, you can replace the file name stored in file_name in the first line and then work through the code from that point on. The best way to do this would be to use a study that is set up as you typically intend to run studies; write your script to do your processing using that dataset as a test case; and then apply the same code step by step to the next study that used that first study as a template.
It’s quite difficult to write a description of what that processing script might look like, but here are some elements you may want to include:
- Dropping variables added by Qualtrics that you don’t want
- Producing a codebook
- Calculating subscale scores
- Producing visualisations of variables of interest
- Producing summaries of missing values and identifying cases to remove based on consistent criteria.
Majority
Important
At the moment, I do not have API access to Qualtrics. So, I’m instead going to simply sketch the steps I will investigate when/if my institution enables API access on my account. If you want to do this process yourself, please be aware that the description below may not be accurate, and will likely require some (extensive) problem-solving!
The Majority level would be quite an undertaking, and as I’ve said, this is hypothetical - I haven’t even managed it myself yet! If you are looking to work at this level, you should be pretty comfortable and confident working in R, since the system would rely as little as possible on point-and-click interfaces and as much as possible on R.
For this system, there are a couple of promising packages. Both make use of the Qualtrics API, which is well-documented but an additional paid feature, so you need to check if you have access to it. If you don’t - well, unfortunately, this won’t work!
Checking API Access
To check whether you have API access on your Qualtrics account:
- Log into Qualtrics
- Click on your account and then Account Settings
- Click the Qualtrics IDs tab
- Check the box labeled API.
Compare what you see there to the description under Getting Your API URL. If it matches what you see there, carry on! If it says what mine does - “The API is not enabled for your account” - then you’ll have to get in touch with your Qualtrics admin and ask for it.
If this is your first contact with an API, well, you’re in for a good time! As an extremely approximate and non-technical explanation, an API (Application Program Interface) is a structure for communicating with an application directly, without using their point-and-click user interface. R packages that utilise APIs have functions that convert your input in R into a format that the API can understand, or make requests for information from the API directly in R. Usually, this involves setting up an authentication system to allow requests from you to be identified and associated with your account.
There are two packages that I’d be interested in using in order to work with Qualtrics via the API, with unfortunately similar names:
- {qualtricsR} contains functions to create surveys and post them to Qualtrics from RStudio.
- {qualtRics} contains functions to retrieve surveys directly from Qualtrics, circumventing the export - download - save - import process.
## Install devtools if necessary
while(!require(devtools)) install.packages("devtools")

## Install qualtricsR from GitHub
devtools::install_github('saberry/qualtricsR')

## Install qualtRics from CRAN
install.packages("qualtRics")
Survey Creation System
The {qualtricsR} package contains a function that takes a CSV or dataframe in R and turns it into a Qualtrics survey. So, here’s the structure I would likely implement:
- Create a new project dedicated to creating Qualtrics surveys.
- Create a new
questionnairesfolder. - Create CSV spreadsheets for each questionnaire separately, e.g. one for the STARS, one for the STAIT, one for the PANAS, and so forth, with obvious filenames (
stars.csv,stait.csv,panas.csv). If I wanted to add or update these questionnaires, I would only ever do it in these CSVs. - Create a CSV logbook recording which questionnaires were included in which studies, and use the logbook to read in the questionnaires and send them to Qualtrics.
In brief, the idea is that you build an archive of questionnaires as CSV files which are accessed using the logbook. The logbook serves as both a system to create the studies, and as a record of what each study contained for future reference and to create codebooks.
Warning
From the help documentation, there are a few outstanding questions that I would want to investigate before fully committing to this system.
- How to set the underlying numeric choices for response options
- How to create different types of questions, e.g. matrix table questions, text response
Survey Access System
The {qualtRics} allows you to read in survey data from Qualtrics directly. So, no having to export and then choose a sensible filename and then save and then import - you could simply read in the most recent copy of the dataset. However, the package documentation says that the functions read in a CSV file - and not a SAV file, which would allow us to use the {labelled} package and all those nifty features of labelled data. So, I’d want to investigate whether the functions can be adapted to import a SAV file instead; if not, I’d probably stick to manual download, since I’d prefer to have the labels rather than the convenience of direct download.
For this download system, I’d have a script or short bit of code that would identify which survey I wanted - depending on which I wanted to analyse - and read it in. This would be part of the project specific to that particular study, rather than in the questionnaire project I described above.
Footnotes
You’re welcome of course to use another, less evil search engine, as you like - I just haven’t tested them all to make sure this page comes up at the top!↩︎
I can’t leave this supremely confident, nigh-hubristic statement just hanging here without a huge flag: NEVER ASSUME YOUR CODE HAS WORKED AS EXPECTED WITHOUT THOROUGH CHECKING/TESTING! For relatively simple setups, and routine steps, you can achieve this, but even for the most basic operations, you should always always always double check what your code has produced.↩︎